Understand the business.
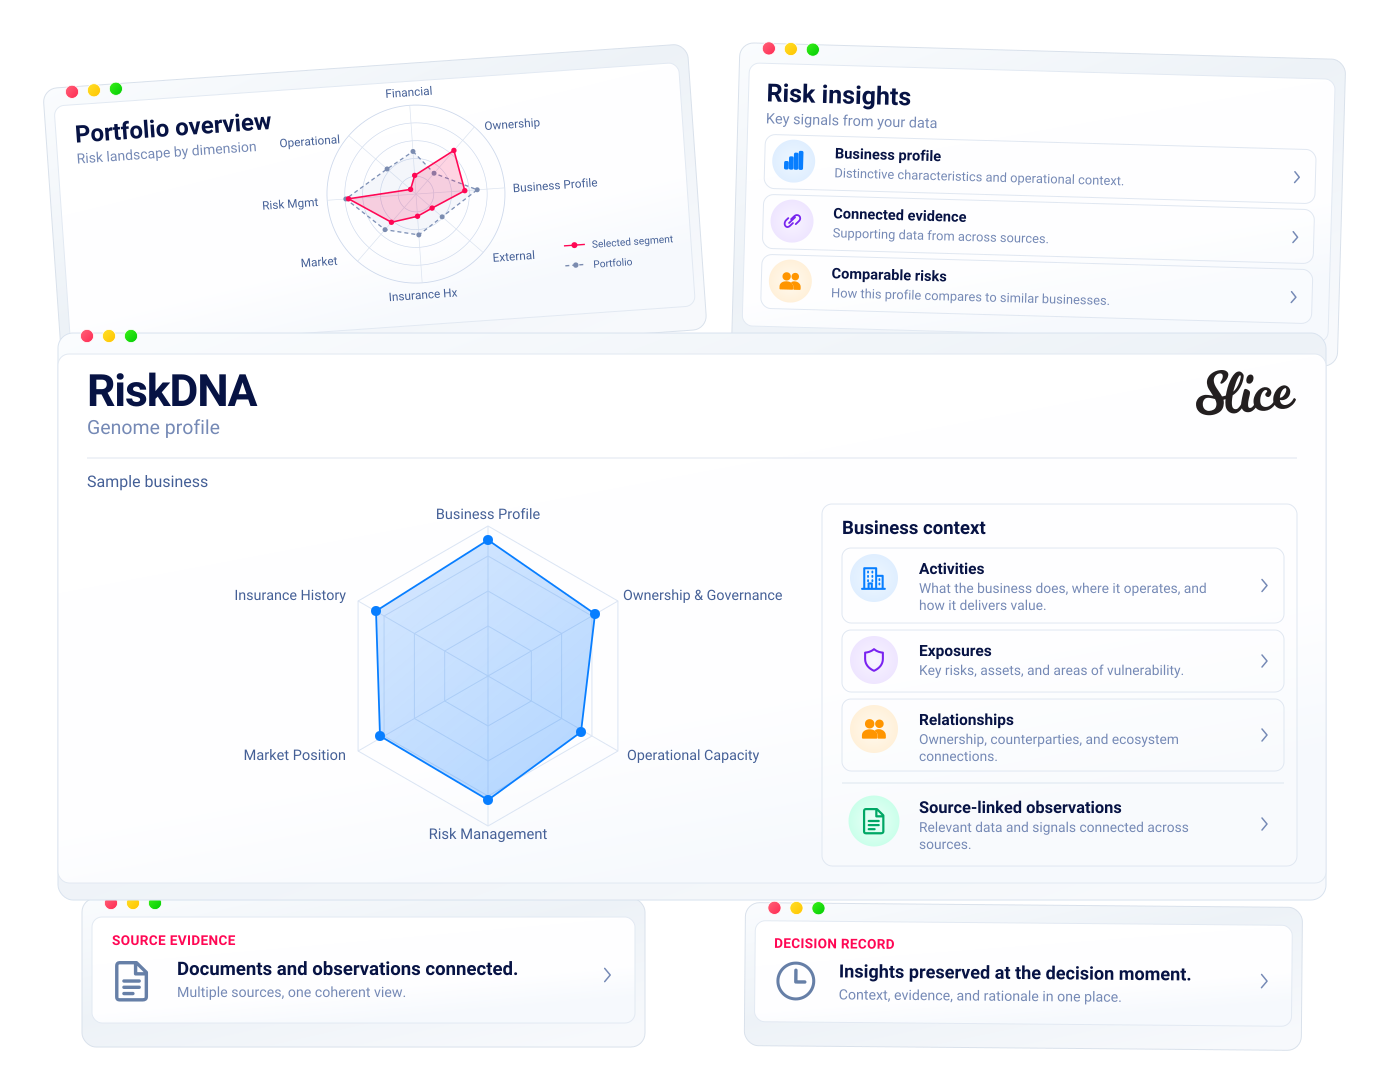
Understand the business profile, ownership, finances, controls, market position and timing. Coverage, geography, distribution channel and market conditions add context.
Business context
RiskDNA / Glass box risk intelligence
RiskDNA gives people and AI agents a shared world view of risk: a structured model of business activities, exposures and relationships. Named, sourced and dated genes preserve what was known, what was priced and what changed. Reasoning starts with that inspectable evidence, not language alone.
RiskDNA models the business.
Slice Mind coordinates the work.
Three vectors / one business sequence
One business genome, represented three ways.
96+ genes
Named, sourced, dated observations
10 chromosomes
Related genes organized into risk dimensions
Genes form chromosomes within one business genome. Three complementary vector representations support comparison and reasoning over the risk.
Named · Sourced · Dated
RiskDNA / Sequencing
Named, sourced and dated genes form chromosomes; chromosomes form the business sequence. Outcomes sit alongside that sequence on a separate axis. Conflicting observations remain evidence to inspect, with their sources intact.
Understand the business profile, ownership, finances, controls, market position and timing. Coverage, geography, distribution channel and market conditions add context.
Business contextKeep sources, dates and confidence visible. Distinguish documented facts from inferred insights, and retain conflicting observations for inspection.
Facts + interpretationSelected chromosome groups
See the risk in context.
Business characteristics, organized for shared understanding.
Illustrative risk profile
Six selected chromosome groups · not an overall risk score
Evidence travels with the risk.
Source → signal → decision
Compare the shape of the risk, then assess whether the coverage, period and outcomes make the comparison useful.
Comparable risksTrack successive snapshots. Connect new exposures and emerging loss experience to the next decision.
Risk trajectoryGround the reasoning
LLMs help interpret documents and reason about evidence. RiskDNA gives that reasoning a persistent model of the business: its activities, exposures, relationships, history and comparable risks. People and AI agents can inspect the same context, question an interpretation and trace observations to their sources as language models evolve.
Sequence activities, exposures and relationships into named attributes. Keep each observation connected to its source and date.
Preserve the risk and insights from people and AI agents at the decision moment. Later evidence adds to the record without overwriting what was known then.
Discover cohorts across multiple dimensions and three vector representations. Bring profitability and retention alongside the risk characteristics those peers share.
RiskDNA / Multidimensional cohorts
RiskDNA compares risks across dimensions and three vector representations. It reveals cohorts beyond ISO class, ZIP code and revenue, bringing together risks whose wider patterns are alike.
◆ Selected risk● Profitable◌ Comparison cohort
Within the illustrative cohort
Compare the selected risk with its peers. Investigate the characteristics and experience associated with profitable business.
The next question is why.
Do differences in controls, coverage, terms or loss experience help explain the profitability of otherwise comparable risks?
Illustrative counts. The selected risk has no outcome assigned; similarity does not guarantee profitability.
Find
Find common risk patterns across businesses that sit in different traditional categories.
Distinguish
Risks in the same class, location or revenue band can have very different operations, exposures and controls.
Understand
Look at profitability within comparable cohorts, then investigate the differences that matter.
The living record
Lifecycle events write snapshots of the risk. The priced moment remains a reference point, so the next decision can use both the original context and the evidence that followed.
Illustrative lifecycle / changing business activities
The application, activity description and available evidence are preserved with the decision context.
New project records describe more work at customer locations. Both observations remain visible with their dates.
Relate subsequent results to the snapshot in force at that time, rather than today’s description of the business.
The drift product is designed to compare current risk with the priced-moment snapshot, explain changes at the gene level and calibrate their significance against the carrier’s own outcomes.
Adverse drift
New activities or exposures may call for a closer look at terms, appetite or pricing adequacy.
Favorable drift
Improved controls or reduced exposures deserve recognition in retention and underwriting decisions.
Risk change and market change are different signals.
A softer market can coincide with rising exposure. Compare both before deciding how to respond.
RiskDNA + Slice Mind
Slice’s AI-first MGA is built for AI agents to carry work from end to end. Inserting people into routine steps recreates human handoffs, queues and dependencies. Shared services connect underwriting, pricing, servicing, claims, distribution, finance and regulatory operations.
The shared risk model: business characteristics, operating context, evidence, confidence and lifecycle snapshots, with outcomes linked separately.
AI agents interpret submissions, research and enrich context, produce insights and recommendations, and coordinate communication and work through approved tools and knowledge bases.
The insurance core — Slice’s Insurance Cloud Services (ICS) — applies configured rules and calculations, executes policy and payment transactions, and maintains tax, reporting and servicing records.
Glass box / Governance and compliance
Inspect the risk model behind the reasoning: named observations, sources, dates and conflicting evidence. People and AI agents work from shared context that can be examined and challenged. Replayability and repeatability remain targets for the next test program.
Talk about the intelligence layerInspect sources, timestamps and confidence behind each gene. Preserve conflicts, identify missing evidence and separate observations from interpretation.
Design target: replay a decision from its observation log with the relevant data, model and rule versions pinned.
People manage objectives, appetite and material decisions. Systems enforce the boundaries for AI agent execution.
Designed tests address repeatability, proxy effects and comparison quality. The first neighborhood-quality report is pending; measured lift must precede claims of improved results.
Governance & compliance
Source-linked observations and lifecycle snapshots help authorized compliance teams, carrier partners and auditors examine what was known about a risk at a particular moment. Inspectable evidence supports oversight, while defined authority and accountable people govern how AI agents act.
Built for the business of insurance
Start with the business sequence. Explore the live foundation and the evidence needed to bring drift, AI agents and network intelligence into your operating model.
